The Top 10 UK Attractions Where Drivers Should Take Extra Caution
We analysed official traffic incident data from the interactive THINK! traffic map to identify UK attractions where drivers should exercise extra caution when passing. Our research aims to promote safer driving habits during Road Safety Week and throughout the dark winter months.
In 2023, it was reported that over 37.2 million holiday-related overnight trips took place within the UK, with the winter season seeing especially busy road conditions as drivers headed to popular landmarks and attractions. Increased traffic around these sites heightens the need for driver awareness and caution during peak holiday periods.
Winter months are particularly hazardous for drivers, as research from InsureTheBox shows that drivers are 20% more likely to experience an accident during this season. Furthermore, a study by Vitality identified distraction as the leading cause of traffic incidents, responsible for 19% of all collisions. To support safer driving practices, especially during Road Safety Week, we’ve compiled a list of the top attractions and stadiums across the UK where motorists should be especially vigilant.
Our research has revealed:
- The UK landmarks with the highest likelihood of traffic incidents.
- UK football stadiums with the most frequent traffic collisions.
- Six tips for staying safe when visiting popular UK destinations during winter.
Continue reading to find out more, starting with the top 3 UK attractions to approach with extra caution…
3) Brighton Pier
12 Incidents per Year

Brighton Pier has 12.4 traffic incidents each year. Crowds and busy roads around the pier create a high-risk area, especially during peak tourist seasons. Drivers here need to stay highly aware due to steady pedestrian crossings and heavy foot traffic nearby.
2) Kew Gardens
14 Incidents per Year
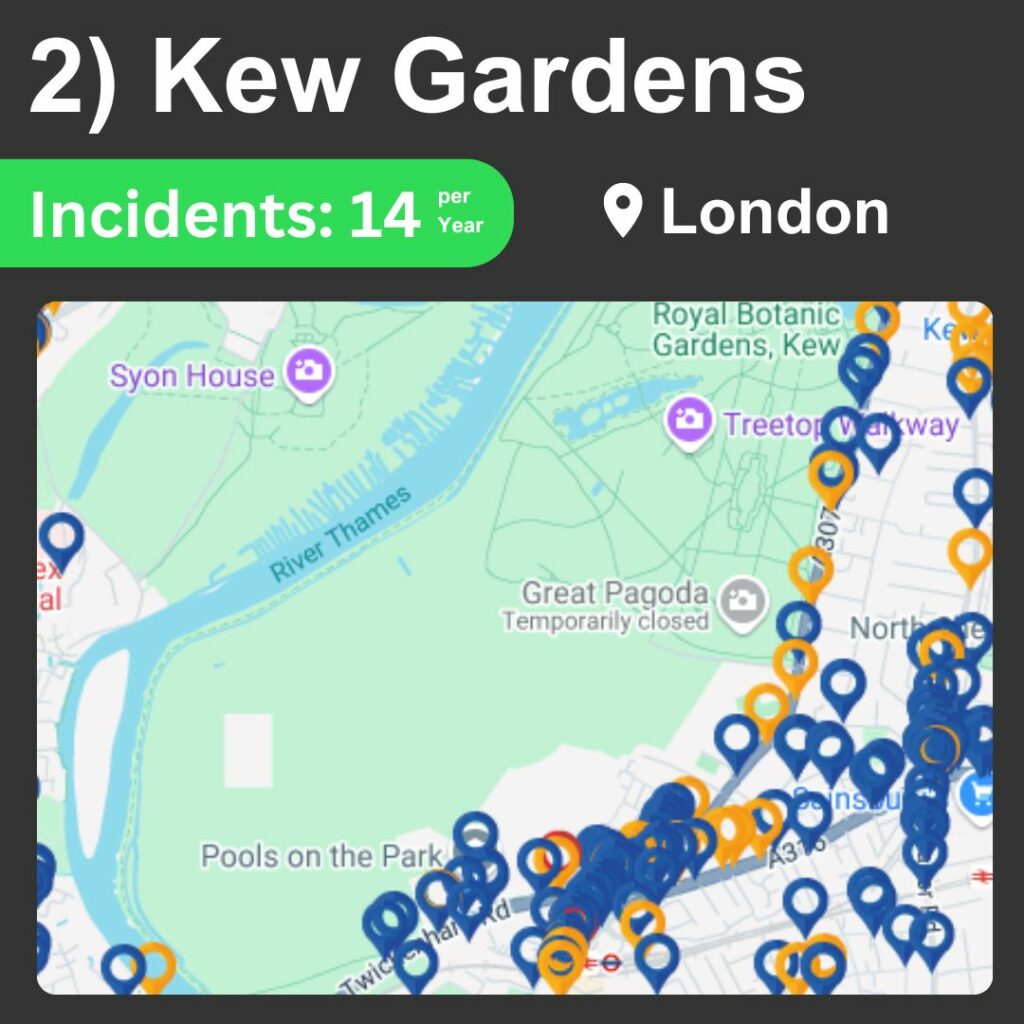
Kew Gardens sees around 14 annual traffic incidents. The high visitor count leads to frequent congestion on nearby roads. Winter can bring even more vehicles, so drivers should be cautious of foot traffic and narrow streets in the area.
1) Tower of London
15 Incidents per Year
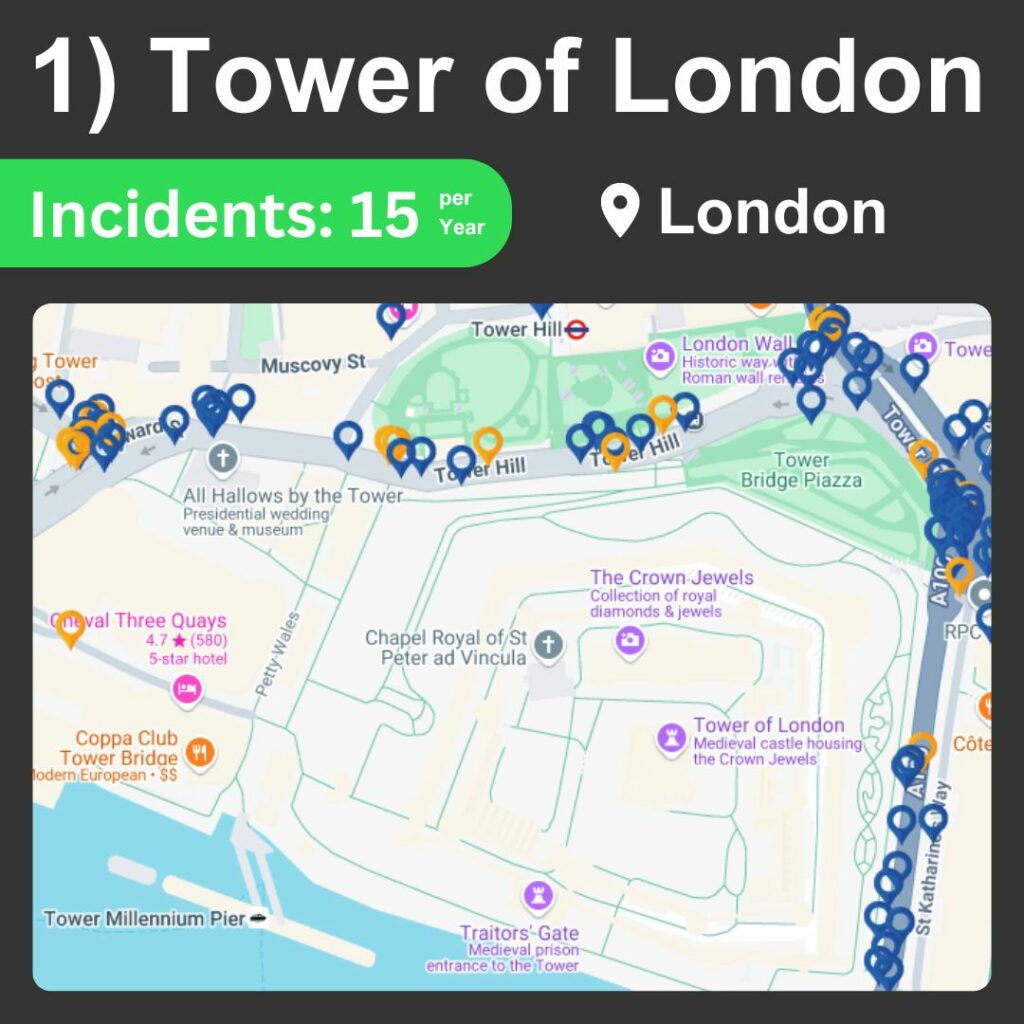
The Tower of London leads with 15.2 incidents annually. Traffic is consistently heavy in this historic zone, especially during high-visit periods. Motorists face extra challenges here as the landmark draws large crowds but has limited driving space.
The Top 10 UK Landmarks Where Drivers Should Take Extra Caution
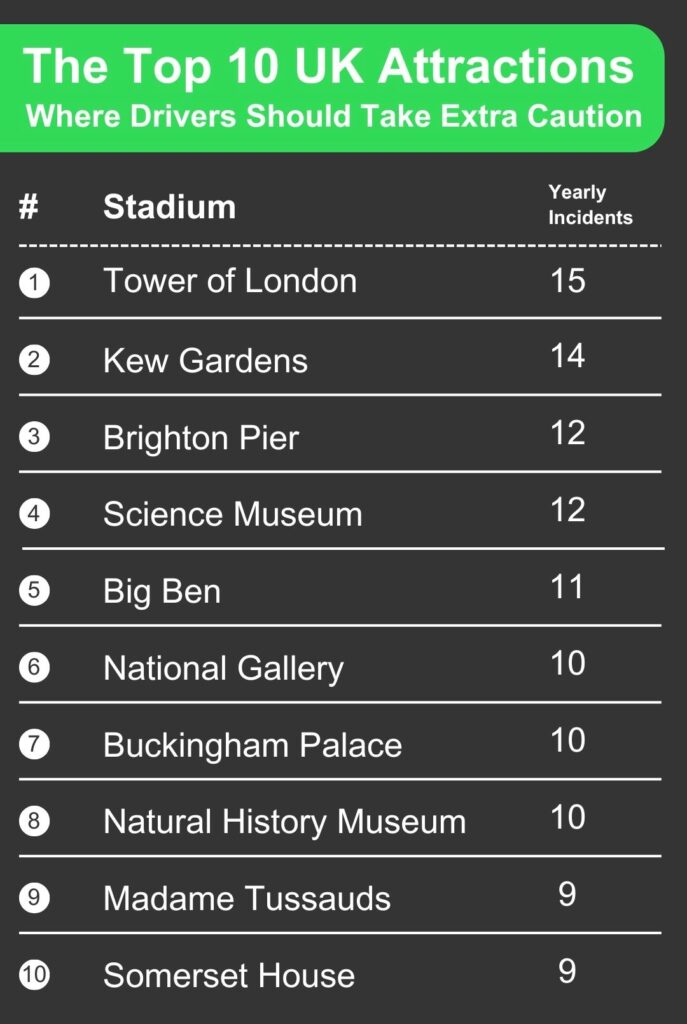
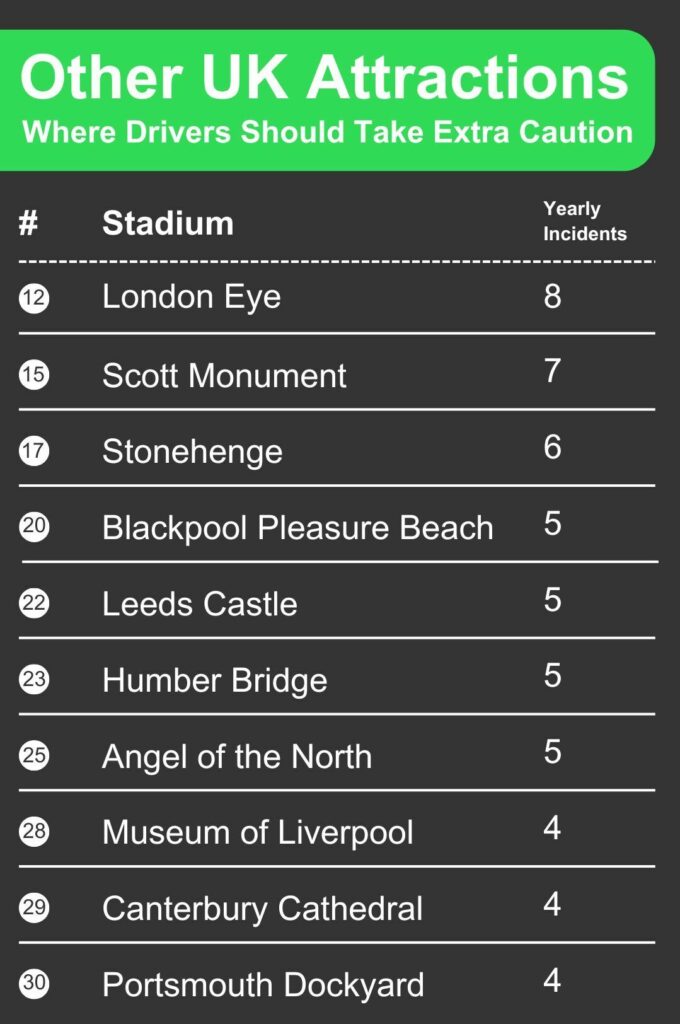
Beyond the top three, the Science Museum and Big Ben each experience around 11–12 incidents per year, with heavy tourist flow adding to congestion. The National Gallery and Buckingham Palace report 10 incidents each due to its narrow streets. Finally, Madame Tussauds and Somerset House see around 9 incidents yearly which makes it essential for drivers to remain cautious around these well-visited sites. Here are how some other notable attractions from around the country rank:
What About UK Football Stadiums?
Football stadiums are particularly busy on match days, with crowds filling nearby streets. Fans often spill into the roads as they make their way to and from the venue. This creates challenges for drivers. Congestion is common, as people cross unexpectedly and gather near entrances. With thousands of fans moving around, navigating these areas safely requires patience and focus.
3) Villa Park
8 Incidents per Year
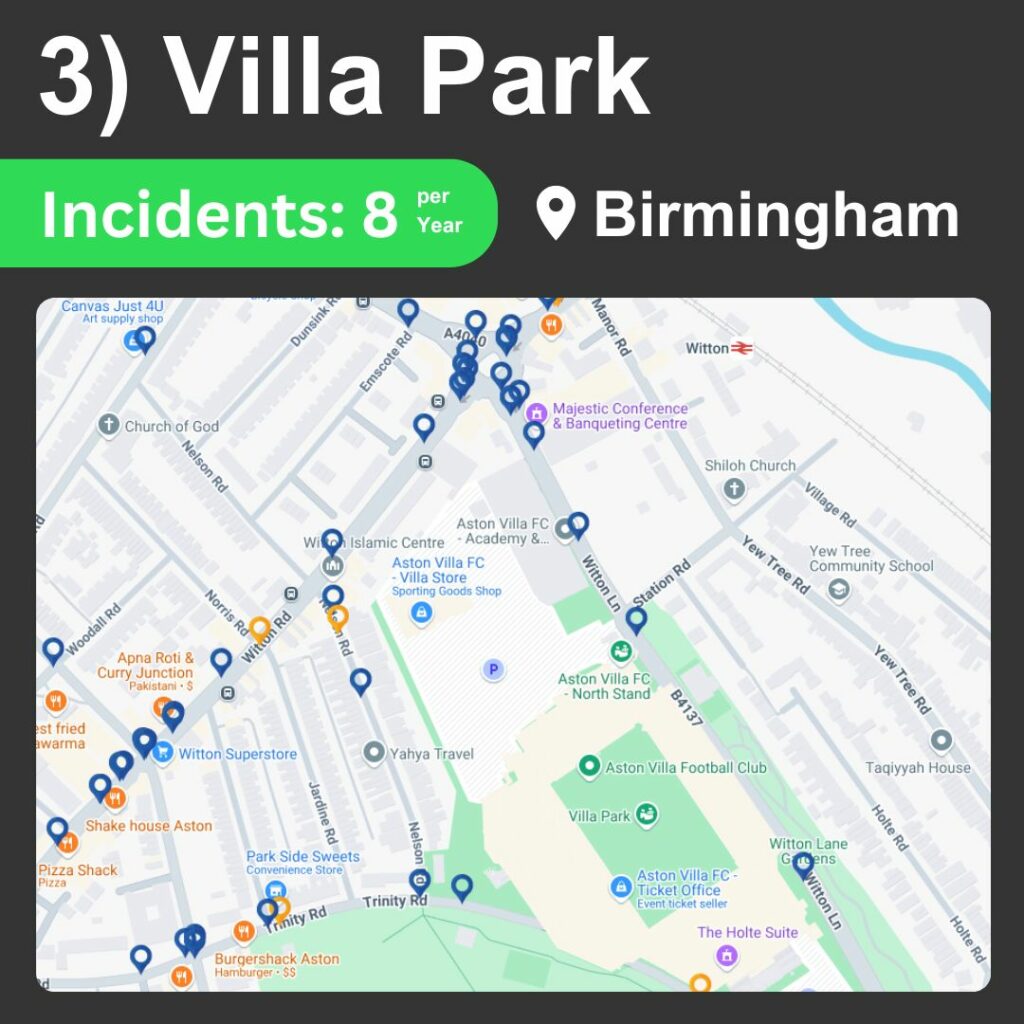
Villa Park experiences roughly 8 traffic incidents per year. Match days bring intense crowding, especially around the stadium’s main entrances. Drivers should stay cautious with fans frequently crossing nearby roads. Residential areas around the stadium also need extra alertness.
2) Old Trafford
8 Incidents per Year
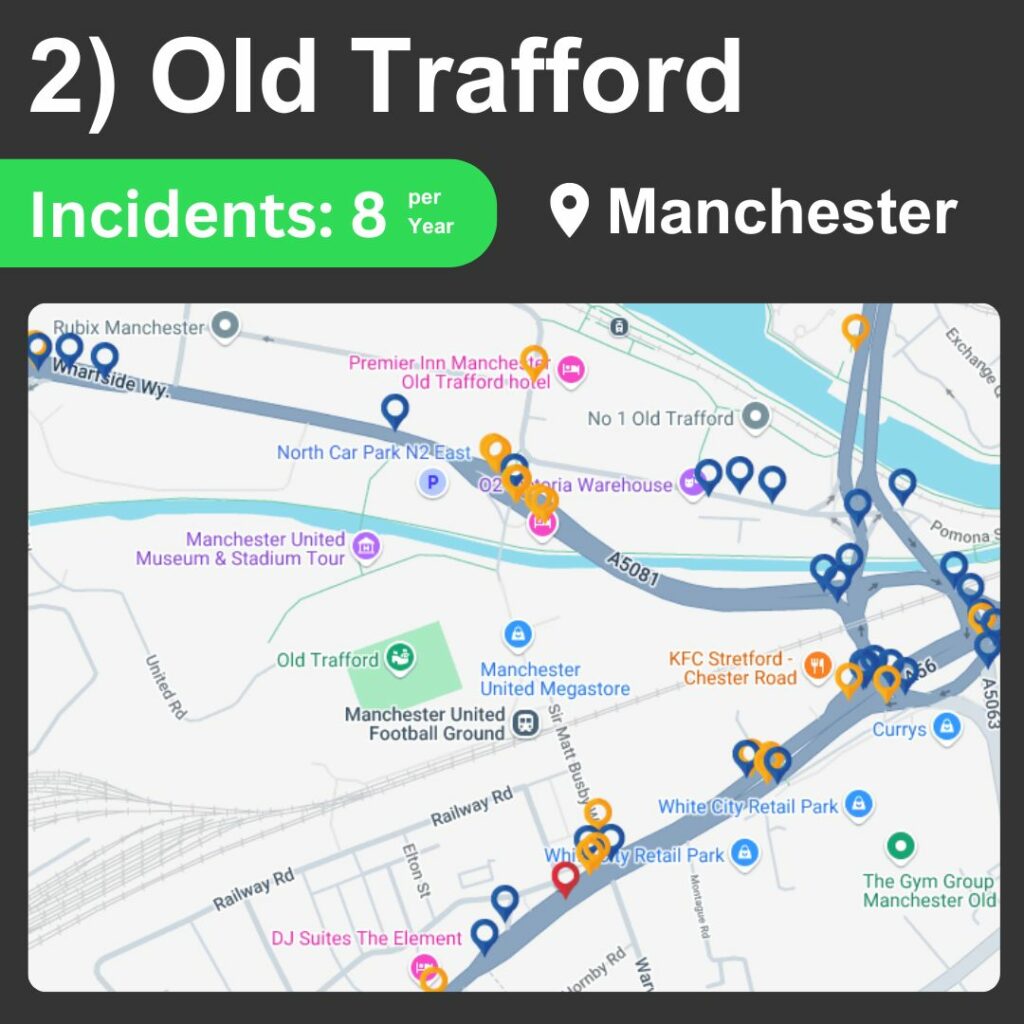
Old Trafford also sees around 8 incidents each year. Large crowds and traffic backups are common during games. Motorists should anticipate congestion as fans flood surrounding streets. Tight roadways and frequent crossings make driving here particularly demanding.
1) Tottenham Hotspur Stadium
9 Incidents per Year
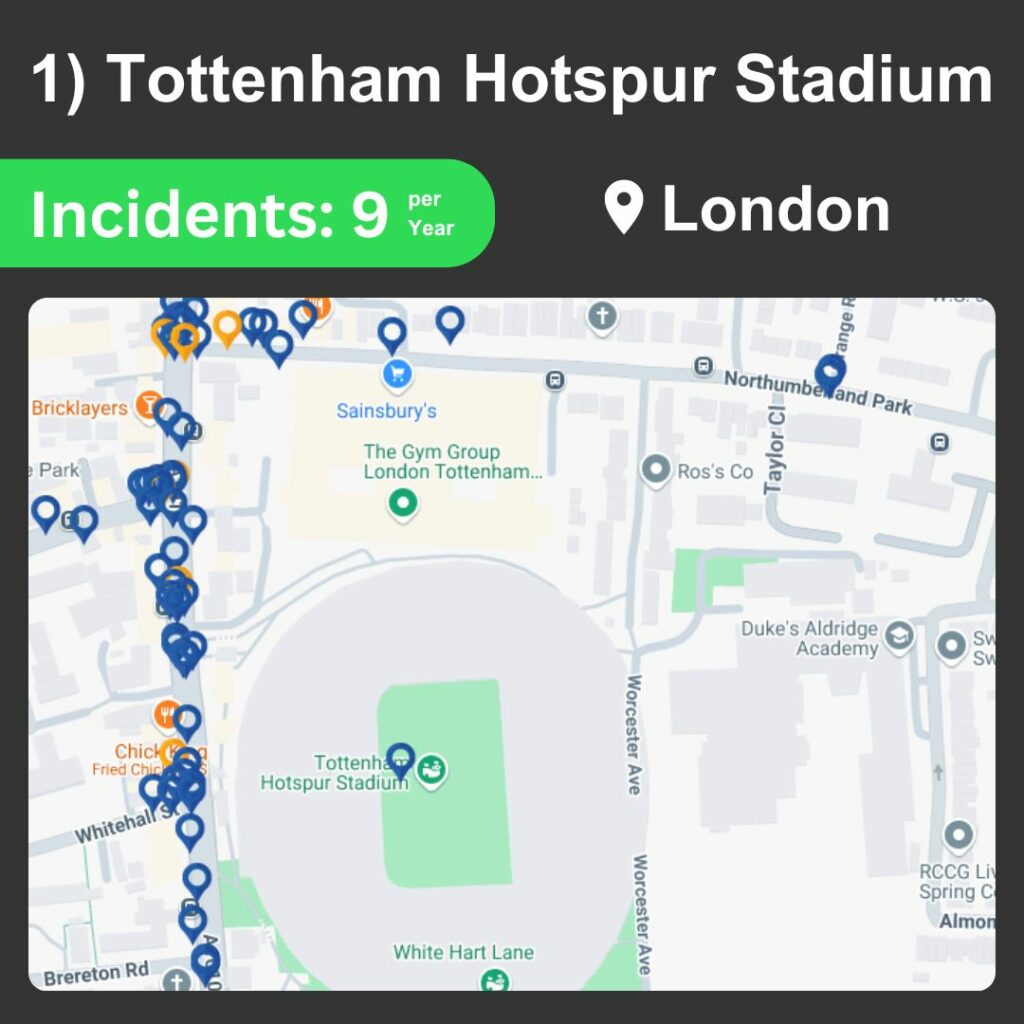
Tottenham Hotspur Stadium has the highest incident rate, with 9 per year. Match days bring surges of pedestrians, creating significant challenges for drivers. Roads nearby are often restricted, which can complicate navigation.
The Top 10 UK Football Stadiums Where Drivers Should Take Extra Caution
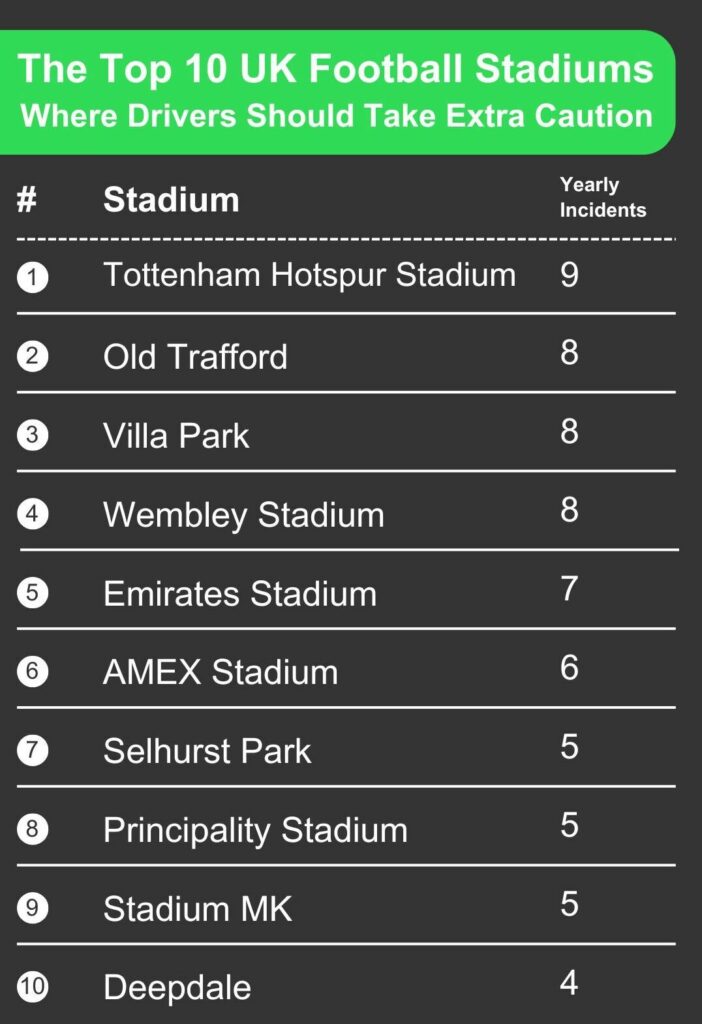
Traffic issues are also notable around other major UK stadiums. Wembley Stadium and Emirates Stadium each record between 7 and 8 incidents annually, with surrounding road congestion playing a role. Selhurst Park and the AMEX Stadium report around 6 incidents per year, while Principality Stadium and Stadium MK each see 5 incidents, where local road layouts present additional challenges. Deepdale rounds off the list with over 4 incidents per year.
Essential Driving Tips for Navigating UK Attractions and Stadiums
Driving near popular UK attractions and football stadiums can be tricky. With crowds, limited parking, and eager fans, staying safe requires extra attention. Here are practical tips to help you navigate these bustling areas smoothly.
1. Plan Your Route and Parking in Advance
Avoid last-minute surprises by planning your route and parking before you set off. Stadiums and attractions often have dedicated parking areas or recommended spots nearby. Checking in advance helps you avoid unnecessary detours or unexpected congestion.
2. Watch for Pedestrians and Cyclists
Popular areas are full of pedestrians and cyclists, especially before and after events. Keep an eye out for people crossing unexpectedly or weaving between vehicles. Staying vigilant is key to avoiding sudden stops or accidents.
3. Stick to the Speed Limit
While it’s tempting to rush in busy traffic, keeping to the speed limit is essential. Speeding in congested areas reduces reaction time. Keeping a steady, legal speed helps ensure safety for you and those around you.
4. Use Public Transport Options Where Possible
Consider using park-and-ride services or public transport to cut down on road congestion. Many attractions and stadiums have convenient public transport links. Reducing cars on the road also helps ease traffic for everyone else.
5. Arrive Early or Plan a Late Departure
Arriving well before the crowd allows for stress-free parking and smooth navigation. If possible, consider leaving after peak crowd times. This can make a big difference in avoiding the worst of the congestion.
6. Follow Event Day Restrictions
Stadiums and popular attractions often have unique rules on event days. Watch for temporary signs, road closures, or diversions around the venue. Respecting these helps you avoid fines and ensures a smoother drive.
Our Thoughts at Ivy Casino
Here’s the thoughts of Ivy Casino representative Mark Good on our research: “With the dark winter months coming up, we wanted to highlight the importance of staying extra vigilant around busy attractions and stadiums and promote responsible travel on UK roads. It does seem that certain attractions and stadiums see an uptick in incidents more than others, so it’s always wise to stay aware of your surroundings. A bit of patience and caution can go a long way in keeping everyone safe.”
Methodology
We collected our data using THINK Map, a tool that compiles official accident data reported to the police by the Department for Transport. For this study, we manually gathered the latest data possible from 2018 to 2022 and calculated the average by dividing the total incidents by the 5 year period we analysed. This gave us a straightforward measure of the average number of crashes per year at each location.
For our complete research of the UK’s landmarks: Click Here
For our complete research of the UK’s football stadiums: Click Here
